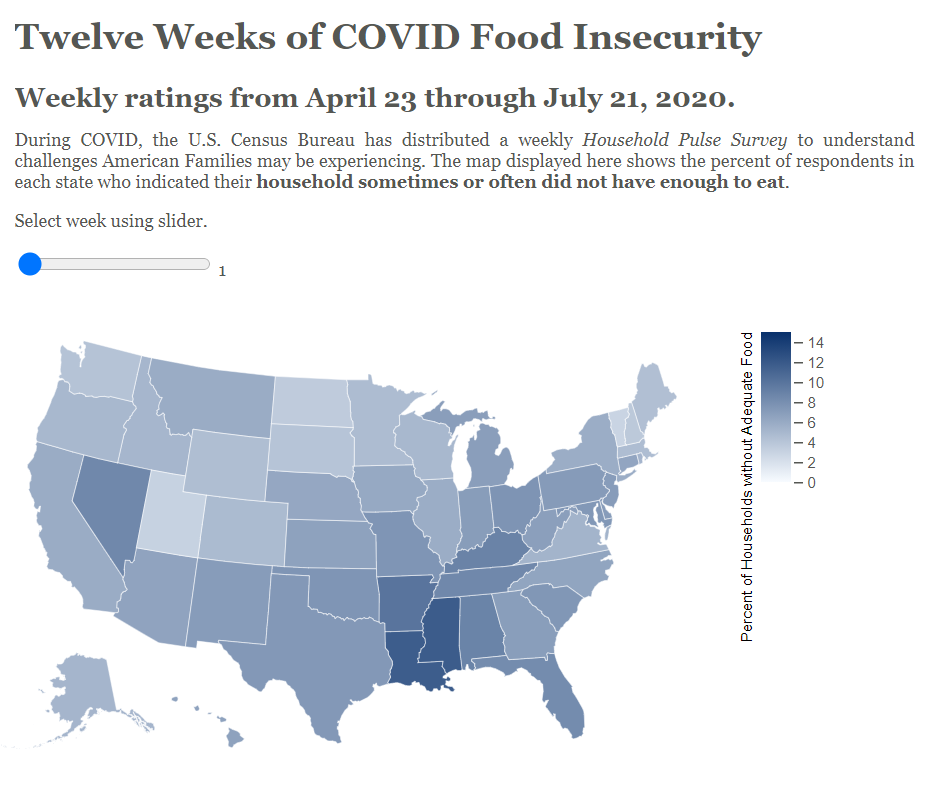
This choropleth map was created to begin exploring data for the American Statistical Association Annual Data Challenge Expo. It displays food security data from the Household Pulse Survey conducted by the Census Bureau during the spring and summer of 2020.
Future iterations of this visualization will include tooltips and an autoplay feature to cycle through the data from each week.